Securing real-time insights for external VF DE partners @Accenture

SUMMARY
Vodafone Germany, my client through Accenture (ACN), commissioned a secure, in‑house Reporting & Notification System (RNS) dashboard to reduce third‑party exposure, tighten data governance, and deliver real‑time operational insights to external partners and enterprise clients.
DISCLAIMER : Due to NDA constraints, this case study presents a high-level overview of the work done and primarily focuses on the design approach.
organization
vodafone de / accenture
Role
Dev, Designer
Team
3 members; 2 Dev, 1 UXD, 1 Lead
Contribution
FE Development / UX / Research
Impact
96%
↘
reduction in accidental data exposure incidents
4.2x
↗
faster onboarding time due to clear role-based interfaces
faster onboarding time for new users from clear role-based interfaces
85%
↘
decrease in time spent managing data access permissions
Problem Background
The client’s reporting system relied on an Atlassian Confluence dashboard setup, which, while systematic and feature-rich, presented a critical security challenge:
[×] Unintended Access: External stakeholders with view-only access were occasionally granted visibility beyond intended dashboard pages due to the hierarchical nature of Confluence.
[×] User Friction: Internal users had to manually de-link associated pages when sharing reports, leading to inefficiencies and confusion.
[×] Outdated Aesthetic & UX: The client desired a more modern and intuitive in-house tool that streamlined access control and real-time data visualization.
The client’s reporting system relied on an Atlassian Confluence dashboard setup, which, while systematic and feature-rich, presented a critical security challenge:
[×] Unintended Access:
External stakeholders with view-only access were occasionally granted visibility beyond intended dashboard pages due to the hierarchical nature of Confluence.
[×] User Friction:
Internal users had to manually de-link associated pages when sharing reports, leading to inefficiencies and confusion.
[×] Outdated Aesthetic & UX:
The client desired a more modern and intuitive in-house tool that streamlined access control and real-time data visualization.
The client’s reporting system relied on an Atlassian Confluence dashboard setup, which, while systematic and feature-rich, presented a critical security challenge:
[×] Unintended Access: External stakeholders with view-only access were occasionally granted visibility beyond intended dashboard pages due to the hierarchical nature of Confluence.
[×] User Friction: Internal users had to manually de-link associated pages when sharing reports, leading to inefficiencies and confusion.
[×] Outdated Aesthetic & UX: The client desired a more modern and intuitive in-house tool that streamlined access control and real-time data visualization.

How might we improve reporting accessibility and security while ensuring a seamless and efficient user experience?
How might we improve reporting accessibility and security while ensuring a seamless and efficient user experience?
How might we improve reporting accessibility and security while ensuring a seamless and efficient user experience?
solution
We designed and developed a custom in-house dashboard that:
[✓] Ensured a stepped access system controlled via a master portal.
[✓] Provided real-time data synchronization while maintaining security constraints.
[✓] Delivered a modernized UI/UX that enhanced usability and efficiency.
We designed and developed a custom in-house dashboard that:
[✓] Ensured a stepped access system controlled via a master portal.
[✓] Provided real-time data synchronization while maintaining security constraints.
[✓] Delivered a modernized UI/UX that enhanced usability and efficiency.

Research + Insights
Competitive Analysis
While there was no external competitor, we analyzed the existing Confluence-based system as our primary reference point.
Key UVPs of Confluence included:
[ 1 ] Intuitive Hierarchical Structure → Simplifies content management.
[ 2 ] Integrated Collaboration & Communication Tools → Enables team workflows.
[ 3 ] Customizable Out-of-the-Box Dashboards → Provides built-in reporting functionalities.
User pain Points & Key Findings
We conducted 8 structured interviews with primary stakeholders actively using the current system.
Key takeaways included:
[ ! ] Access Confusion: Users struggled with inconsistent access controls, leading to unintentional content exposure.
[ ! ] Manual Workarounds: Teams had to de-link pages manually before sharing reports.
[ ! ] Outdated Interface: The system felt cluttered and non-intuitive, leading to inefficiencies in report retrieval.
UX Strategy
+ System Design
UX Strategy + System Design
Design Goals and Constraints
[ 1 ] Enhanced Access Control: Implement a tiered permission model to ensure security.
[ 2 ] Real-Time Synchronicity: Maintain dynamic data updates without compromising performance.
[ 3 ] Modern & Intuitive UI: Redesign the dashboard to be visually engaging and user-friendly.
[ 1 ] Enhanced Access Control: Implement a tiered permission model to ensure security.
[ 2 ] Real-Time Synchronicity: Maintain dynamic data updates without compromising performance.
[ 3 ] Modern & Intuitive UI: Redesign the dashboard to be visually engaging and user-friendly.
Designing for responsiveness

IA & Access Flow
We restructured the information hierarchy to prevent unintended access:
[ 1 ] Master Portal → Admin Controls → User-Specific Dashboards
[ 2 ] Granular Role-Based Access Control (RBAC) for secure page visibility.
[ 3 ] Automated Link Restrictions to prevent accidental data exposure.
We restructured the information hierarchy to prevent unintended access:
[ 1 ] Master Portal → Admin Controls → User-Specific Dashboards
[ 2 ] Granular Role-Based Access Control (RBAC) for secure page visibility.
[ 3 ] Automated Link Restrictions to prevent accidental data exposure.
Designing for Access
User level access view

Admin level access view

Reflections
key learnings
[ ! ] Security-First Design: Access control was a core UX challenge, and solving it improved user trust. Ensuring data integrity through granular access permissions reduced unintentional visibility issues.
[ ! ] Balancing Customization & Simplicity: Our approach struck a balance between providing flexibility for power users while maintaining an intuitive experience for less technical stakeholders.
[ ! ] Iterative Testing Matters: Continuous feedback loops, including usability testing and stakeholder input, were instrumental in refining the dashboard’s usability for real-world needs.
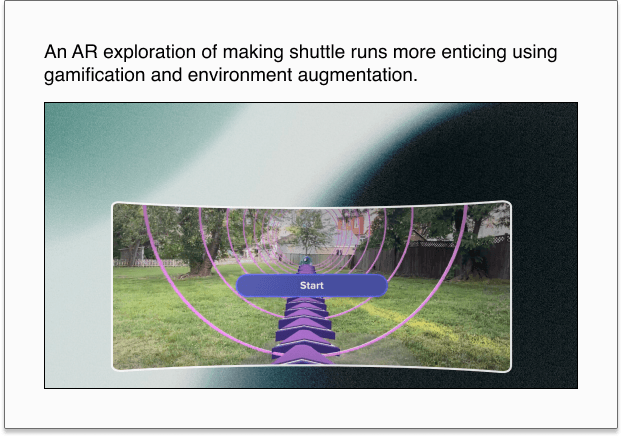
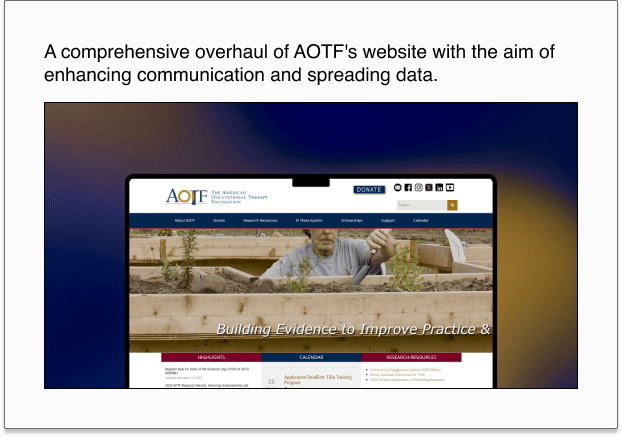
MORE PROJECTS

MORE PROJECTS


brutifully made using framer and nextjs
© 2026, anmol mishra
© 2026, anmol mishra
brutifully made using framer and nextjs
© 2026, anmol mishra